Standard Deviation Meaning: Formula, Examples, and Crypto Volatility Explained
Table of Contents
- What Does Standard Deviation Mean?
- The Standard Deviation Formula Explained
- Variance vs. Standard Deviation: What’s the Difference?
- Population vs. Sample Standard Deviation
- Standard Deviation and the Normal Distribution
- Interpreting Standard Deviation in Crypto Markets
- Rolling Volatility: Moving Standard Deviation in Trading
- From Standard Deviation to Sharpe Ratio and CV
- Outliers, Z-Scores, and Confidence Ranges
- Common Pitfalls and Best Practices
What Does Standard Deviation Mean?
Standard deviation meaning boils down to a single idea: how spread out your data is around the average. If numbers cling closely to the mean, the standard deviation (SD) is small. If values scatter widely, SD is large. In finance and crypto, that “spread” translates to volatility—how much returns jump up or down from day to day. The wider the swings, the higher the volatility, and the higher the standard deviation.
Think of standard deviation as a ruler for dispersion. It tells you whether a series of returns is calm or chaotic, if a token’s price gently drifts or whipsaws. That’s why analysts and traders use SD to compare assets, evaluate risk, and set expectations around outcomes. It’s also the gateway to other tools—z-scores, Sharpe ratios, confidence intervals—making it a foundational concept for anyone who wants to quantify uncertainty rather than guess it.
In everyday terms, if an asset’s returns have an SD of 2%, most days will be near the mean return, with fewer days producing unusually large gains or losses. If the SD is 15%, you’re signing up for more dramatic moves and a wider range of possible outcomes.
The Standard Deviation Formula Explained
At its core, standard deviation follows a simple path: compute the mean, measure each observation’s distance from that mean, square those distances, average them (this is the variance), and then take the square root. The square root brings units back to the original scale—critical for interpretation.
For a population, the variance divides by N (the number of observations). For a sample, it divides by n − 1 (Bessel’s correction) to reduce bias. The result is the sample standard deviation, which better estimates the true population dispersion when data is limited.
- Calculate the mean of your data.
- Subtract the mean from each value and square the difference.
- Sum the squared differences.
- Divide by N (population) or by n − 1 (sample) to get variance.
- Take the square root to get standard deviation.
In crypto returns, daily percent changes are used. The sample standard deviation of daily returns is often annualized by multiplying by the square root of 252 (trading days) to express volatility on a yearly basis. This helps compare assets and strategies on the same scale.
Variance vs. Standard Deviation: What’s the Difference?
Variance and standard deviation measure the same concept—dispersion—but they differ in units and interpretability. Variance is in squared units, which makes it less intuitive. Standard deviation is the square root of variance, returning the measure to the original units, so it’s easier to reason about.
| Metric | What it measures | Units | Interpretation |
|---|---|---|---|
| Variance | Average squared distance from the mean | Squared units (e.g., %^2) | Useful for math and modeling; less intuitive |
| Standard Deviation | Typical distance from the mean | Original units (e.g., %) | Intuitive volatility gauge; used for risk, z-scores, Sharpe |
In practice, you often compute variance as an intermediate step to get standard deviation. The variance helps in portfolio theory and optimization because it plays nicely with algebra, while standard deviation is the language traders use to communicate expected variability.
Population vs. Sample Standard Deviation
When you have all possible data points (the entire population), you divide by N. But real-world analysis usually relies on samples—limited slices of data—so we divide by n − 1 to avoid underestimating variability. This adjustment, known as Bessel’s correction, slightly inflates the variance and standard deviation to better reflect the true population dispersion.
| Context | Denominator | When used | Pros/Cons |
|---|---|---|---|
| Population SD | N | Complete datasets (e.g., all trades ever) | Accurate if truly complete; rare in practice |
| Sample SD | n − 1 | Subsets (e.g., last 90 days of returns) | Less biased estimate; standard for inference |
In crypto analytics—where regimes shift and new tokens launch—data windows are almost always “sample” data. Choose n − 1 unless you can justify that you have the full population, which is uncommon in evolving markets.
Standard Deviation and the Normal Distribution
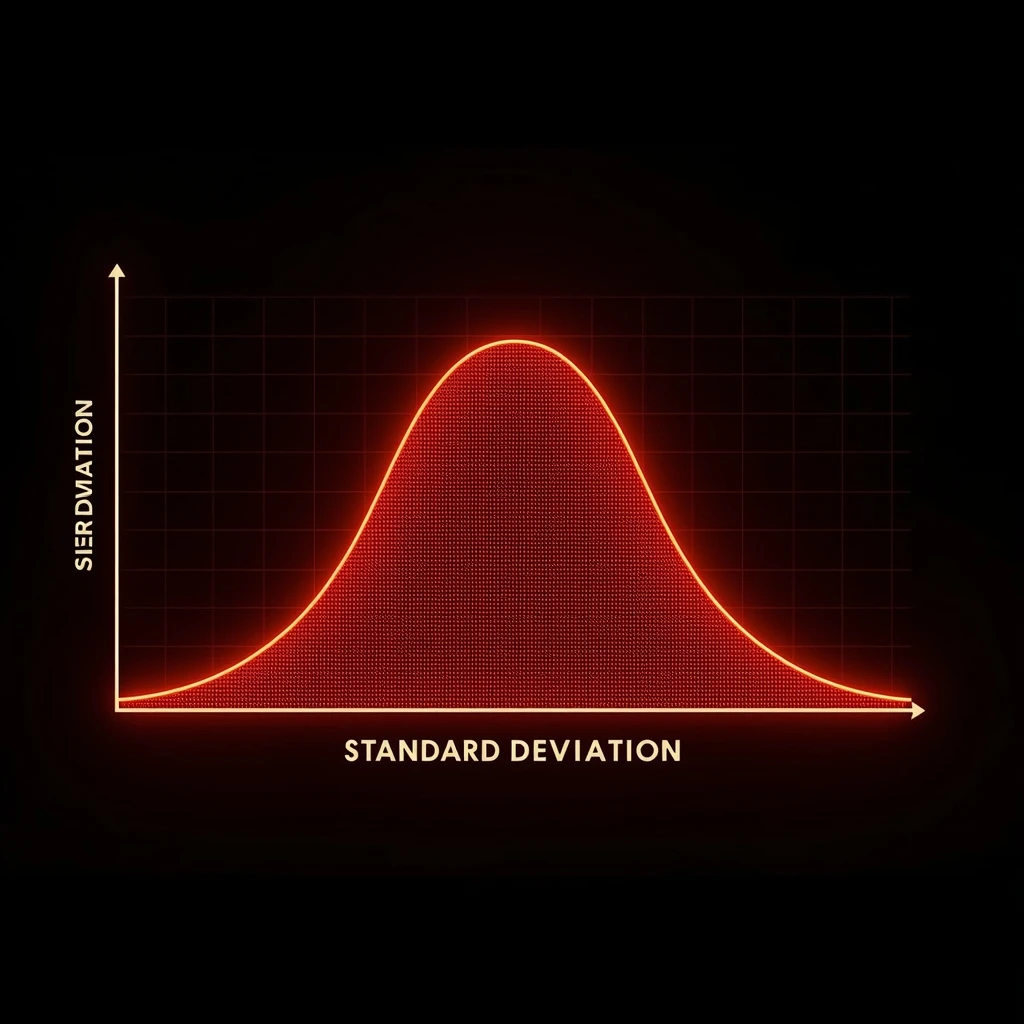
Standard deviation is closely tied to the normal (bell-curve) distribution. Under normality, roughly 68% of values fall within ±1 SD of the mean, 95% within ±2 SD, and 99.7% within ±3 SD. This offers quick, intuitive bounds for expected outcomes. But markets—and especially crypto—often show fat tails: extreme moves happen more often than a normal curve would predict.
That doesn’t make standard deviation meaningless. It remains a solid baseline for dispersion and still enables practical tools like z-scores and risk thresholds. It just means you should be cautious about assuming that ±2 SD contains 95% of outcomes in a heavy-tailed world. Complement SD with tail-risk measures such as Value at Risk (VaR), Expected Shortfall, or non-parametric quantiles for a more robust picture.
When data are skewed or heavy-tailed, consider robust dispersion measures alongside SD, such as the median absolute deviation (MAD). Still, SD remains the lingua franca of risk because it integrates smoothly into portfolio math and performance metrics.
Interpreting Standard Deviation in Crypto Markets
In crypto, standard deviation is synonymous with volatility. A token with a 30-day SD of daily returns at 2% is relatively stable compared to one at 8%. Higher SD implies a wider distribution of returns—bigger potential upside, bigger potential drawdowns.
- Low SD: calm price action, narrower confidence bands, easier position sizing
- High SD: choppy action, wider bands, stricter risk controls
Context matters. A 4% SD may be volatile for a stablecoin (red flag) yet tranquil for a small-cap token. Compare SD to the asset’s peers and to its own history (regime shifts, bull/bear cycles). Annualize SD to compare across assets and timeframes, and track changes to detect volatility clustering—periods where high volatility begets more volatility.
Traders also monitor how SD interacts with mean returns. High volatility with low or negative average returns implies a poor risk-adjusted profile, while moderate volatility with steady positive returns is attractive. That’s where the Sharpe ratio becomes useful, but SD is the starting point.
Rolling Volatility: Moving Standard Deviation in Trading
Markets evolve, so a single, full-sample standard deviation can hide regime changes. Rolling volatility solves this by computing a moving standard deviation over a fixed window—say, the last 20 days—updated daily. This reveals how dispersion changes over time and helps tune risk dynamically.
Common windows include 10, 20, 30, and 60 days. Shorter windows react faster but can be noisy; longer windows are smoother but lag more. Many strategies adjust position sizes inversely to rolling volatility: when SD rises, reduce exposure; when SD falls, allow larger positions. This is a simple form of volatility targeting, popular in both traditional finance and crypto quant strategies.
For DeFi yield strategies, rolling SD on daily PnL can flag when conditions are becoming unstable. For directional traders, a spike in rolling SD can signal breakout regimes or heightened event risk, suggesting tighter stops and smaller size.
From Standard Deviation to Sharpe Ratio and CV
Standard deviation meaning becomes more actionable when paired with return. The Sharpe ratio scales average excess return by volatility: higher Sharpe means you are being paid more per unit of risk. Because SD is the denominator, reducing noise via stable returns can boost Sharpe even if the mean return doesn’t change.
The coefficient of variation (CV) divides SD by the mean, offering a dimensionless way to compare variability across different scales. CV is useful when comparing assets or strategies with very different levels of average return or price. In crypto, where magnitudes vary wildly, CV and Sharpe complement each other to give a fuller picture of risk-adjusted performance.
Don’t forget downside-specific metrics. Standard deviation treats upside and downside equally, but many investors care more about drawdowns. Pair SD with maximum drawdown, Sortino ratio (using downside deviation), and tail metrics. Still, SD remains the first step: a common language to discuss uncertainty, build confidence bands, and size risk.
Outliers, Z-Scores, and Confidence Ranges
Z-scores convert raw observations into standard deviation units: z = (x − mean)/SD. This standardization reveals how unusual a value is relative to the data’s typical dispersion. A z-score of +2 means the observation is two SDs above the mean—rare under normality, less rare in fat-tailed crypto data.
Z-scores underpin many detection and filtering techniques:
- Outlier flags: mark returns with |z| > k (often k = 2 or 3) for review
- Threshold alarms: volatility breaks when rolling SD or |z| exceeds a set level
- Normalization: feed standardized features into machine learning models
Confidence ranges rely on SD, too. If you assume approximate normality, a ±2 SD band around the mean return gives a rough 95% interval for daily outcomes. Analysts also compute standard error (SE) of the mean—SD divided by the square root of n—to express uncertainty about the mean itself. SE shrinks as sample size grows, reflecting increasing confidence in the estimated average.
Common Pitfalls and Best Practices
Standard deviation is powerful yet easy to misuse. Avoid these traps and apply these practices to get the most from SD.
Common pitfalls:
- Assuming normality in fat-tailed markets and underestimating tail risk
- Using stale, full-sample SD that ignores regime shifts
- Confusing population and sample formulas (N vs n − 1)
- Comparing SDs across assets without annualizing or context
- Treating upside volatility as “bad” when goals are asymmetric
Best practices:
- Use rolling SD to capture time-varying volatility
- Annualize for comparability and align windows to strategy horizons
- Complement SD with drawdown, downside deviation, VaR/ES, and skew/kurtosis
- Normalize via z-scores for feature engineering and outlier checks
- Stress test: simulate shocks and bootstrap to assess robustness beyond SD
To visualize the implications, compare two tokens’ recent return profiles with the same mean but different SD:
| Asset | Avg Daily Return | Daily SD | Risk Profile | Implication |
|---|---|---|---|---|
| Token A | 0.10% | 1.5% | Lower volatility | Predictable outcomes; larger position sizing possible |
| Token B | 0.10% | 6.0% | High volatility | Wider swings; smaller sizes and tighter risk controls |
Both average returns are identical, but the standard deviation meaning here is decisive: Token B’s wider spread implies greater uncertainty. The same mean with more dispersion changes how you trade, size, and hedge.
FAQ
What does standard deviation mean in simple terms?
It is the typical distance each data point sits from the average, a compact way to describe how spread out or clustered your numbers are.
Why is standard deviation important?
It translates variability into a single, comparable number so you can judge consistency, risk, and volatility across datasets, assets, or strategies.
How is standard deviation calculated?
Compute the mean, subtract it from each value, square those differences, average them (variance), then take the square root; for samples, divide by n−1 to apply Bessel’s correction.
What is the difference between population and sample standard deviation?
Population standard deviation uses the true population and divides by N, while sample standard deviation estimates population spread from a subset and divides by n−1 to reduce bias.
What does a low standard deviation tell us?
Values are tightly clustered around the mean, signaling stability, predictability, and low volatility.
What does a high standard deviation indicate?
Values are widely dispersed, implying higher uncertainty, more extreme moves, and greater volatility.
How does standard deviation relate to volatility in crypto prices?
Volatility is commonly measured as the standard deviation of returns; higher standard deviation of returns means more price turbulence.
Can standard deviation be negative?
No, it is never negative; it is zero only when all observations are identical.
What are common mistakes when interpreting standard deviation?
Assuming a normal distribution when it isn’t, comparing standard deviations across different units or scales, using price levels instead of returns, and trusting small-sample estimates too much.
When should I use standard deviation instead of eyeballing the chart?
Use it whenever you need an objective, comparable measure of dispersion to rank risks, set position sizes, or feed models and risk controls.
How does standard deviation relate to the normal distribution?
Under a normal (bell-curve) model, standard deviation fully sets the scale of variability, enabling probability estimates for how far observations stray from the mean.
What share of values lie within 1, 2, and 3 standard deviations?
About 68%, 95%, and 99.7% of values respectively, if the data are approximately normal.
How do outliers affect standard deviation?
Outliers can inflate it substantially because squaring deviations magnifies extreme values; consider robust alternatives if outliers are frequent.
What is a rolling standard deviation?
It is the standard deviation computed over a moving window (for example, 30 days) to track changing volatility through time.
How many data points do I need for a reliable standard deviation?
More is better; as a rule of thumb, 30+ observations give a more stable estimate, but in fast-moving crypto you often use longer rolling windows to smooth noise.
Standard deviation vs variance: what does each mean?
Variance is the average squared deviation from the mean (in squared units); standard deviation is its square root, back in the original units and easier to interpret.
Standard deviation vs mean absolute deviation: what is the difference in meaning?
Both measure spread, but standard deviation penalizes large deviations more due to squaring, while mean absolute deviation is more robust and linear.
Standard deviation vs standard error: how do they differ?
Standard deviation describes dispersion of individual data points; standard error describes uncertainty in an estimate like the mean and typically equals SD divided by the square root of sample size.
Is standard deviation the same as volatility?
In finance, volatility usually means the annualized standard deviation of returns, so the concepts align, with a time-scaling convention.
Standard deviation vs range: which tells me more about spread?
Range uses only the min and max and ignores the middle; standard deviation uses all observations, reflecting the overall dispersion.
Standard deviation vs interquartile range (IQR): when to use which?
IQR focuses on the middle 50% and is robust to outliers; standard deviation is more informative under near-normal data but is sensitive to extremes.
Standard deviation vs coefficient of variation: what is the difference?
Coefficient of variation is standard deviation divided by the mean, giving a unitless relative dispersion; it is useful for comparing scales but unstable if the mean is near zero.
Standard deviation vs z-score: how do they relate?
A z-score tells you how many standard deviations a value sits from the mean, standardizing observations for comparison across datasets.
Standard deviation vs beta in markets: what does each measure?
Standard deviation captures absolute volatility of an asset; beta captures relative co-movement with the market, so an asset can have low beta but high standard deviation.
Standard deviation vs skewness: what is each telling me?
Standard deviation measures spread, while skewness measures asymmetry; you can have the same spread with very different left/right tail behavior.
Standard deviation vs kurtosis: how do they differ?
Standard deviation quantifies overall variability; kurtosis describes tail heaviness and peak shape, which affects the likelihood of extreme moves even if SD is the same.
Standard deviation of price levels vs returns in crypto: which meaning is more useful?
Standard deviation of price levels mixes trend and scale effects, while standard deviation of returns isolates volatility; returns-based SD is the standard for risk.